Scientists used Starlink satellites to map Earth's upper atmosphere for the first time

Space may seem 'empty' to us, but there are faint traces of Earth’s atmosphere hundreds of kilometers above the surface. Due to this, as satellites fly through the layers of air, they experience a small resistance known as atmospheric drag. Over time, this drag can slowly change a satellite’s orbit and cause it to move lower. Scientists have wanted to measure this drag to understand and forecast satellite motion and reduce the risk of collisions in orbit. But getting accurate measurements high above Earth isn’t easy. Now, researchers from Kyoto University have traced the first-ever snapshot of it using Starlink satellites.
Instead of building new instruments, the research team used SpaceX's Starlink satellites that are already in orbit. They tracked how roughly 1,200 of these satellites' orbits slowly decayed over time, and using that data, the researchers were able to estimate atmospheric density at an altitude of about 482 kilometers, in a layer known as the thermosphere. Commenting on the project’s origin, corresponding author Mamoru Yamamoto said, "This is a multidisciplinary study between space science and space engineering. Reading papers from both research fields, we realized that deeper dialogue between researchers from both fields is necessary."
How did they actually pull this off?
For this research, the team used tomography, which is the same imaging technique behind medical scans. The team applied it to roughly 1,200 Starlink satellites flying at an altitude of 482 kilometers. By tracking the atmospheric drag showing up as gradual orbital decay, they calculated density readings around each satellite, then stitched them all together. With the data, they were able to produce a two-dimensional, latitude-by-longitude map of thermospheric density at around 500 kilometers up. According to the team, it's the “first tomographic snapshot of thermospheric density.”
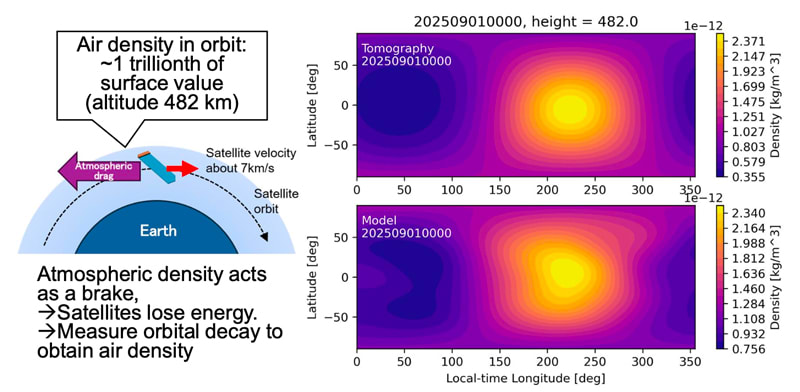
When the researchers compared their results against measurements from the European Space Agency's SWARM satellites, the two data sets lined up closely. It also builds on the group's earlier study, which used general orbital tracking data, known as TLE data, to see how density changes with time and altitude. This new work shows a horizontal, geographic view of how density varies across the planet.
What does this mean for the crowded sky above us?
Better density maps mean that we will be able to make better predictions of where satellites will end up, and this will be helpful as low Earth orbit fills up with active satellites and dead debris alike. The researchers think that these “methods used may also eventually be able to support near-real-time monitoring of atmospheric density around satellites, strengthening space-weather forecasting and helping to make future space operations safer and more reliable,” as per the universe’s official release.
More on Starlust
SpaceX Falcon 9 rocket impact crater on the Moon spotted by South Korean orbiter—see first pictures
Elon Musk may consider Starship's heat shield problem 'solved', but experts think it's a 'dead end'