HETDEX astronomers spot hidden galaxies and gas from up to 11 billion years ago
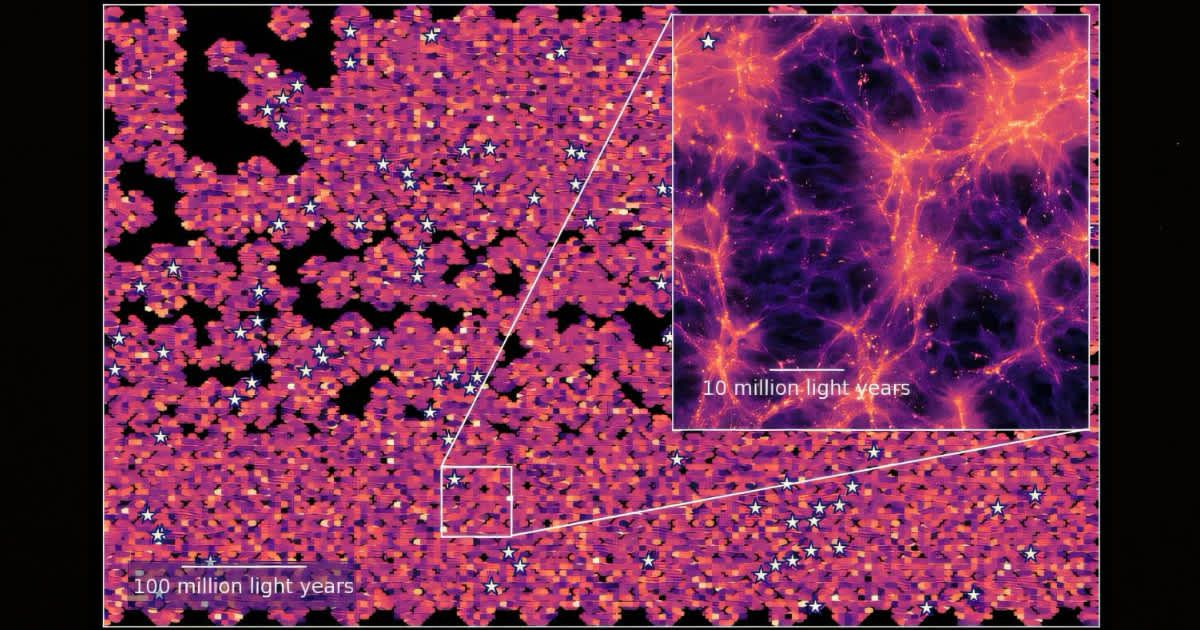
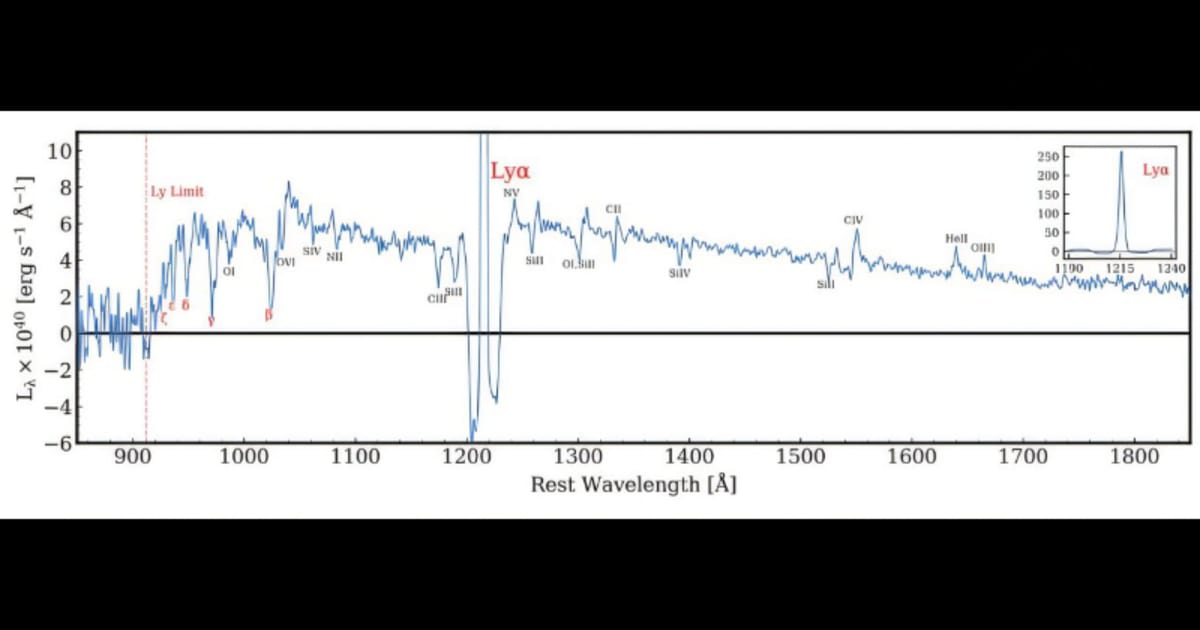
Using data from the Hobby-Eberly Telescope Dark Energy Experiment (HETDEX), a team of astronomers has created the most detailed map yet of Lyman alpha from 9 to 11 billion years ago. As it is the light emitted by hydrogen when it is excited by a star's energy, Lyman alpha can prove to be useful in tracking down bright galaxies from the early days of the universe. The astronomers, however, even managed to bring some of the fainter galaxies and gas from that time into view using a technique referred to as Line Intensity Mapping (LIM).
“Observing the early universe gives us an idea of how galaxies evolved into their current form, and what role intergalactic gas played in this process,” said Maja Lujan Niemeyer, a HETDEX astronomer and a graduate of the Max Planck Institute for Astrophysics in Germany who led the team, in a statement. “But because they are far away, many objects in this time are faint and difficult to observe." LIM observes how peaks and valleys of spectra are distributed over a region rather than taking a one-by-one approach. This, of course, is nothing new. That being said, it is the first time LIM is being used with such a large dataset, thanks to the HETDEX project, which has the ability to gather over 600 million spectra of light spanning a region in the sky as large as 2000 full Moons.
“HETDEX observes everything in a patch of sky, but only a tiny amount of that data is related to the galaxies that are bright enough for the project to use. But those galaxies are only the tip of the iceberg. There’s a whole sea of light in the seemingly empty patches in between," added Lujan Niemeyer. In order to map the light, the researchers wrote their own program and sifted through about half a petabyte of data using supercomputers at the Texas Advanced Computing Center. They then used the location of the bright galaxies already identified by HETDEX as reference points to spot the fainter galaxies and gas.
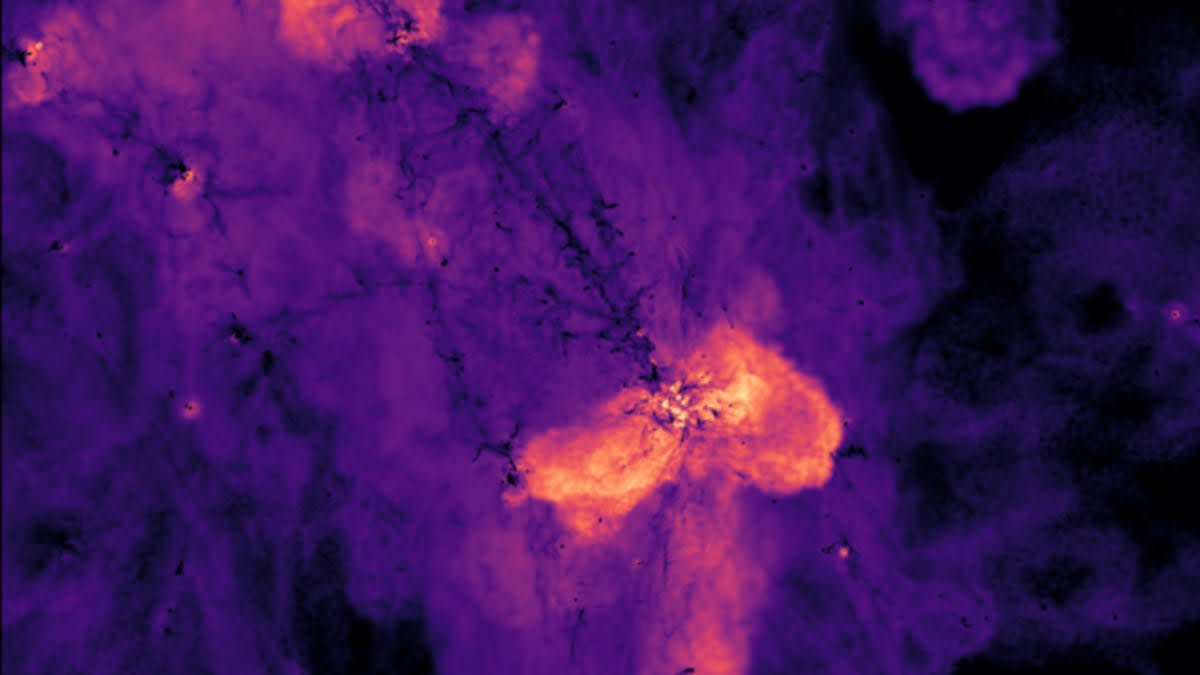
This made sense because gravity has a habit of pulling matter together. “So, we can use the location of known galaxies as a signpost to identify the distance of the fainter objects,” said Eiichiro Komatsu, a HETDEX scientist, scientific director at the Max Planck Institute for Astrophysics, and co-author of the paper published in The Astrophysical Journal. The resulting map not just brought the fainter objects in the region into view, it also brought the bright galaxies into greater focus.
This research will now serve as a verification tool for existing simulations. “We have computer simulations of this period, but those are just simulations, not the real universe. Now we have a foundation which can let us know if some of the astrophysics underpinning those simulations is correct,” Komatsu added. This map will help in advancing our understanding of how our universe evolved into its present state. The map comes on the heels of another detailed 3D map of the universe created using radio detectors.
More on Starlust
Dusty galaxies from the universe's far edges show star formation had begun earlier than suspected
Gravitational waves may finally reveal how fast the universe is expanding