Scientists create 3D map of the sun's magnetic interior to help improve predictions of solar flares
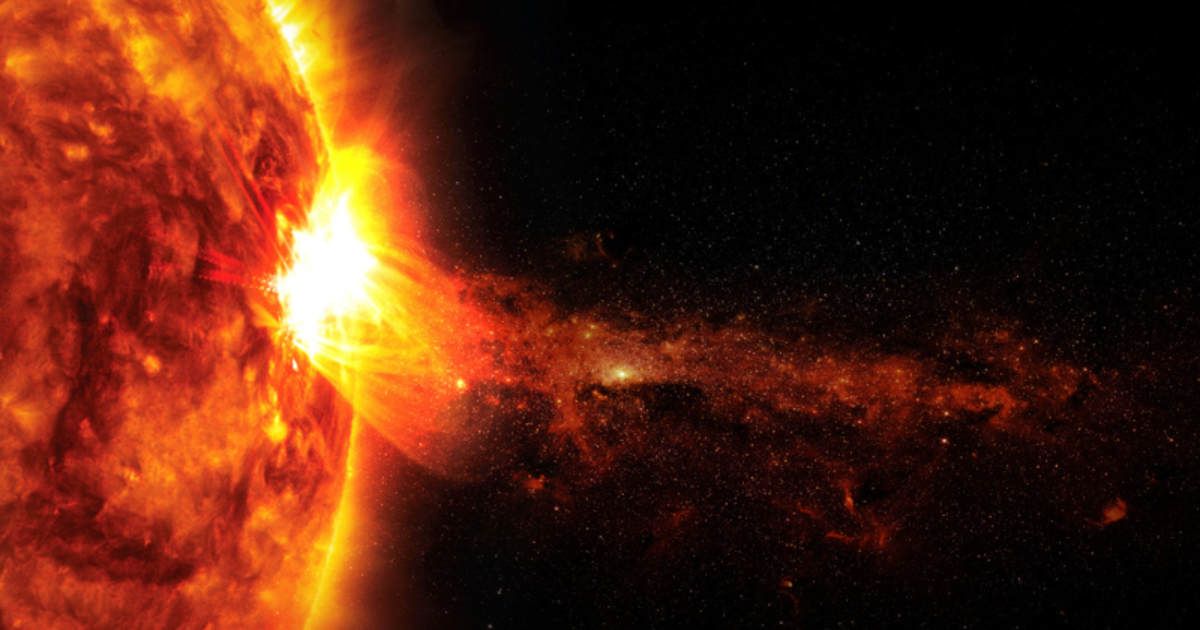
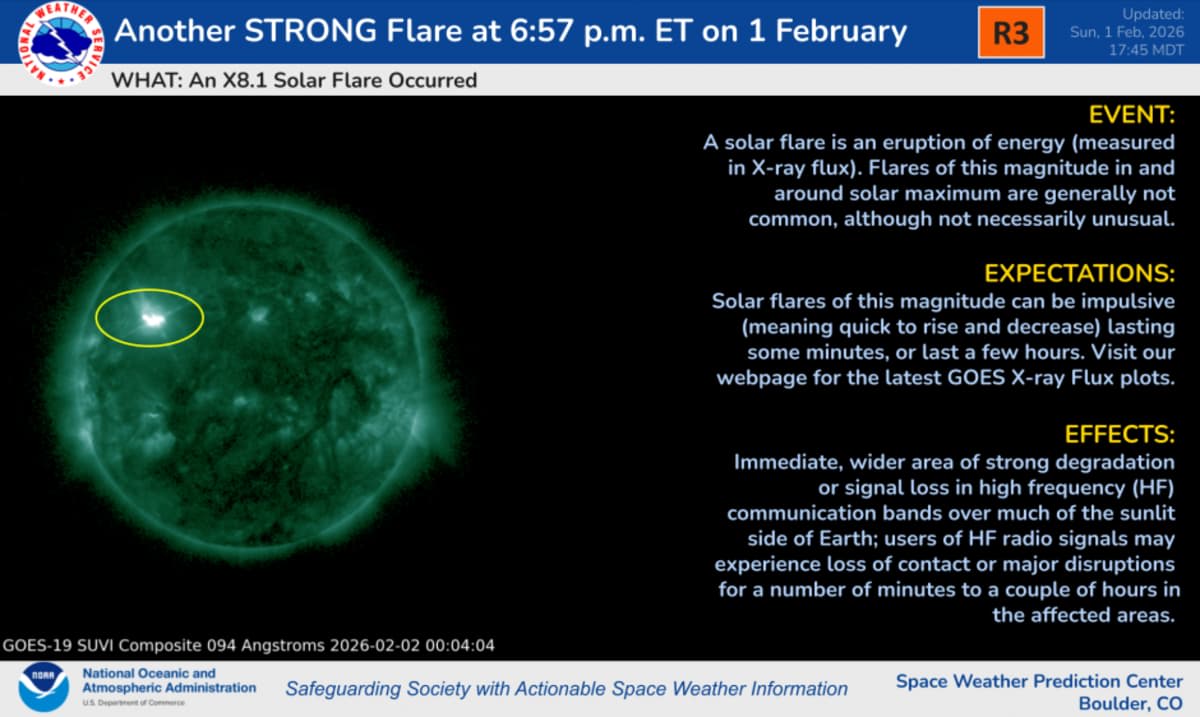
Researchers at the Indian Institute of Technology, Kanpur, India, have used satellite data collected over a period of 30 years to create a 3D map of the Sun’s interior magnetic field. Based on their model, this map will help scientists better understand conditions in the Sun’s plasma interiors, which in turn will help predict solar weather better. This could help prevent the adverse effects of events like solar flares and coronal mass ejections on communications, exploration, and aviation, much like the recent X8.1-class solar flare that caused R3 radio blackouts in places across the world.
Co-authored by Soumyadeep Chatterjee and Gopal Hazra of IIT, Kanpur, the paper published on January 20, 2026, makes use of the photospheric magnetogram data from the Michelson Doppler Imager (MDI) on board the Solar and Heliospheric Observatory (SOHO) and the Helioseismic and Magnetic Imager (HMI) aboard the Solar Dynamics Observatory (SDO), along with helioseismic differential rotation data. The data they examined spans a period of three decades, beginning with SOHO’s very first observations ever since it was deployed by NASA and ESA at the Earth-Sun L1 Lagrange point in February 1996. Though SOHO was meant to last only 3 years, to this very day, it has been providing useful information to contextualize data from the much-improved SDO, which was launched in 2010.

“Despite very precise measurements of the Sun’s surface magnetic field, the lack of direct access to the solar interior has long limited our understanding of how the solar dynamo actually works,” Chatterjee, who led the research as a PhD scholar at IIT-K, said about the crux of the problem the study solved, according to Education Times. In it, what is referred to as a “solar dynamo,” which is a churning process deep inside the Sun fueled by plasma motion and rotation, is the key reason behind the 11-year solar cycle of heightened solar activity from sunspots and eruptions. The main hurdle for researchers for years has been these interior characteristics, which stay hidden from direct view, even with tools like helioseismology, which tracks internal rumblings of massive amounts of plasma shifting about. By assimilating 30 years of data about the Sun’s mysterious surface into their 3D computational model known as the Babcock-Leighton dynamo model, they reconstructed the interior’s large-scale fields with more than just a theoretical basis, showing how these deep forces shape the chaotic surface events.

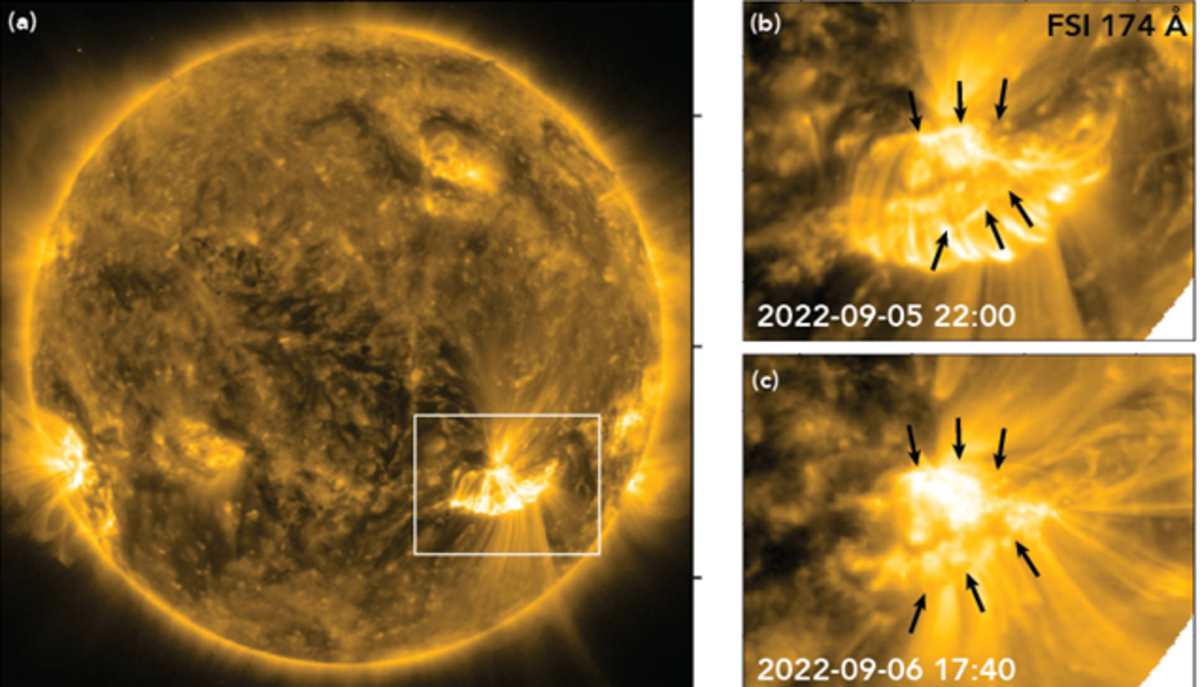
“The underlying idea is that if deep-seated magnetic fields strongly influence surface activity, then long-term surface observations should retain signatures of these internal fields. One of the major strengths of the study is its reliance on real observations rather than purely theoretical simulations. Anchoring the model to actual data allows the researchers to place meaningful constraints on the strength and behaviour of magnetic fields beneath the solar surface,” Chatterjee said as he explained their methodology. This involved surface magnetograms from MDI and HMI that carried faint “echoes” of inner magnetism, and over decades, these built a clear picture of toroidal loops migrating towards the equator. These toroidal loops match the butterfly diagrams, polar fields, and sunspot counts collected for Solar Cycles 23 to Solar Cycle 25. This data anchor makes their map quite realistic and predictive for future solar weather activity.
Solar activity, like flares, radiation storms, solar winds, and coronal mass ejections (CMEs), carries space weather risks. Flares are sudden blasts of radiation and are classified by a lettering system, with X-class being the strongest. The effects of two such solar flares were felt at least 5 times in the last 20 days or so. The first of them was an X1.9-class one erupting from sunspot region 4341 on January 18, followed by four in the last 48 hours. The former blacked out radios by ionizing the atmosphere, resulting in a coronal mass ejection, or CME. CMEs hurl solar material laced with magnetism, sparking geomagnetic storms as well. Solar winds are constant particle streams from coronal holes, which can get amped by storms, and some of the above-mentioned events are enough to cause damage to satellite equipment, while radiation storms can endanger astronauts. What this study does is help forecast all of these things better.
More on Starlust
NASA resumes efforts to reconnect with MAVEN as solar conjunction ends
ESA's Proba-3 images multiple solar prominence eruptions in just hours